 Book Call with Haroon
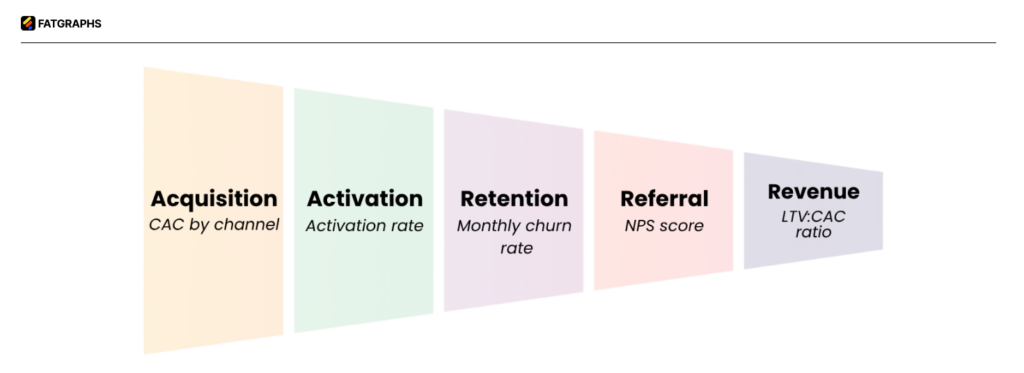
The AARRR Framework is a growth operating system that breaks the customer lifecycle into five measurable stages: Acquisition, Activation, Retention, Referral, and Revenue. Each stage represents a point where growth can either accelerate or stall, depending on how effectively users move forward.
Most companies assume growth problems are caused by low traffic. In reality, growth usually slows because one stage in the lifecycle is underperforming. The framework exists to identify that constraint so it can be fixed before scaling.
AARRR is a five-stage growth framework for startups and B2B SaaS companies, created by Dave McClure in 2007. It stands for Acquisition, Activation, Retention, Referral, and Revenue. Also called Pirate Metrics, it maps your entire customer journey from how users first find you to how you make money from them, so you can find and fix exactly where growth is breaking down.
You are getting traffic. You have sign-ups. But something is not working. Maybe users are not converting. Maybe they sign up and disappear. Maybe revenue is flat even though your pipeline looks full. These are not random problems. Every single one maps to a specific stage in the AARRR framework. And once you know which stage is broken, you know exactly where to focus.
This guide is written for B2B SaaS founders and marketers who are already in motion, not people who need a basic intro to growth. You will find the real problems that break each AARRR stage, why they happen, and how to fix them. Each section also includes the metrics to watch and the benchmarks to compare yourself against.
Why B2B SaaS Teams Use the AARRR Framework
Most B2B SaaS companies are tracking the wrong numbers. Page views, follower counts, and email list size. These look good in reports but do not drive decisions. The AARRR framework, also called the Pirate Metrics funnel, exists to fix this.
Dave McClure built AARRR after watching founders drown in dashboards full of metrics that did not connect to revenue. His core argument was simple: if a metric does not help you understand acquisition, activation, retention, referral, or revenue, it is a vanity metric, and it is wasting your attention.
For B2B SaaS specifically, the framework matters even more because:
- You depend on recurring revenue churn at any stage, destroying compounding growth
- Your buyers involve multiple decision-makers, and the funnel is not linear
- Your CAC is high, and losing a customer after acquisition is extremely expensive
- Your product is invisible; users cannot touch it, so activation and perceived value drive everything
The AARRR funnel works as an early warning system. When a stage starts degrading, you see it before it hits your ARR. That is the real value of tracking all five stages consistently.
To understand how each stage connects to your overall marketing system, read our guide on building a B2B SaaS marketing funnel.
The 5 Stages of AARRR Framework: Quick Reference
Before diving into each stage, here is the full picture in one place:
| Stage | The question it answers | Primary metric | Healthy benchmark |
|---|---|---|---|
| Acquisition | How do users find you? | CAC by channel | CAC payback under 12 months |
| Activation | Do users experience value? | Activation rate | Define your own “aha moment” event |
| Retention | Do users come back? | Monthly churn rate | Below 2% monthly for SMB SaaS |
| Referral | Do users tell others? | NPS score | NPS above 50 is excellent |
| Revenue | Are you making money efficiently? | LTV: CAC ratio | 3:1 minimum, 5:1 is strong |
Now, let us go through each stage with the specific problems that cause B2B SaaS teams to get stuck and how to fix them.
Stage 1 ➞ Acquisition: Why You Are Getting the Wrong Users
Acquisition is how people find your product. SEO, content marketing, paid ads, LinkedIn, partnerships, outbound, all of it lives here. The goal is not just traffic. It is high-quality users who are likely to activate, stay, and pay.
The most common Acquisition problems in B2B SaaS
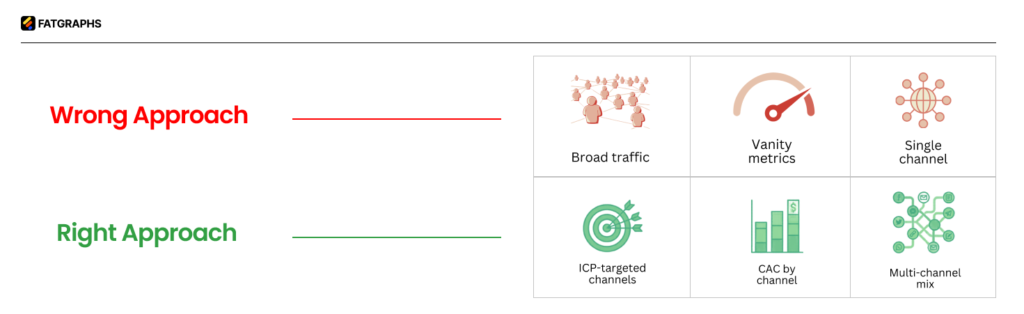
Problem: High traffic, low sign-up quality. You are attracting visitors who are not your ICP. This usually happens when your content targets broad keywords (“what is SaaS”) instead of intent-specific ones (“SaaS onboarding best practices for B2B”). Broad traffic fills the top of your funnel with people who will never buy.
Problem: CAC is too high, and payback is too slow. SaaS customer acquisition costs have increased significantly. B2B SaaS CAC now averages $2 for every $1 of new ARR. If your CAC payback is beyond 18 months, you are burning capital faster than you can recover it.
Problem: Over-reliance on one channel. If 80% of your sign-ups come from one source, you have a fragile business. A single algorithm change or ad policy update can collapse your pipeline overnight.
How to fix it?
- Define your SaaS buyer persona precisely. Every acquisition channel decision flows from knowing exactly who you are trying to attract.
- Focus paid spend on high-intent channels. Google competitor conquering (targeting “Competitor alternatives” keywords) captures buyers already evaluating. LinkedIn Ads work well when narrowed by job title, company size, and industry.
- Build content that targets bottom-of-funnel search intent comparison pages, use case guides, and ROI calculators to convert evaluators much better than top-of-funnel awareness content.
- Track CAC by channel individually. Most companies average their CAC across all channels and miss that one channel has a 3-month payback while another has an 18-month payback.
Key Acquisition metrics to track
- Customer Acquisition Cost (CAC) by channel
- CAC payback period (target: under 12 months)
- Qualified sign-ups per channel (not just total sign-ups)
- Lead-to-demo conversion rate
For a full breakdown of which channels perform best for B2B SaaS, read our guide on the best marketing channels for B2B SaaS ranked by ROI.
Stage 2 ➞ Activation: Why Users Sign Up and Do Nothing
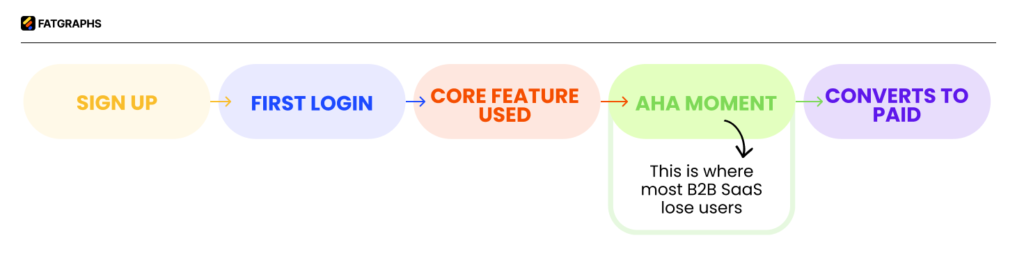
Activation happens when a new user experiences the core value of your product for the first time. In SaaS, this is called the “aha moment,” the moment a user understands why your product matters to them specifically.
This is the most underinvested stage in most B2B SaaS companies. Teams spend heavily on acquisition and almost nothing on helping users reach value quickly.
The most common Activation problems in B2B SaaS
Problem: Users sign up, log in once, and never return. This is the clearest sign of a broken activation stage. The user did not reach their aha moment. Either onboarding is too long, the product is too complex to navigate alone, or the value proposition in the product does not match what marketing promised.
Problem: Time-to-value is too slow. In B2B SaaS, if a user does not see clear value within their first session, you have likely lost them. Long setup processes, missing integrations, and forms that ask for too much information before showing anything useful all destroy activation.
Problem: You have not defined your activation event. If your team cannot name the single action that best predicts whether a new user will convert to paid, you cannot optimize for it. Facebook’s benchmark became famous for a reason: users who added 7 friends within 10 days had dramatically higher long-term retention. Every SaaS product has an equivalent event. Most teams have not found theirs.
How to fix it?
- Use Mixpanel or Amplitude to run a retention cohort analysis. Find the action that users who retained took in their first session, and those who churned did not. That action is your activation event.
- Redesign your onboarding to get users to that action as fast as possible. Remove every step that does not directly lead to it.
- Add interactive product tours. More than half of large B2B purchases now start with digital self-serve exploration users want to see value before talking to anyone.
- Reduce friction on setup. If your product needs integrations to show value, build one-click connectors for the most common tools your ICP uses.
Key Activation metrics to track
- Activation rate (percentage of sign-ups who reach your activation event)
- Time-to-value (hours or days from sign-up to first value moment)
- Free-to-play conversion rate
- Feature adoption rate for core features
Stage 3 ➞ Retention: Why Customers Leave Before They Should
Retention is the most important stage in the AARRR framework for B2B SaaS. Not acquisition. Not revenue. Retention.
Here is why: acquiring a new customer costs 5–25x more than keeping an existing one. And a 5% increase in retention can boost profits by 25–95%. No acquisition strategy can overcome poor retention. If your bucket is leaking, filling it faster is not the answer.
The most common Retention problems in B2B SaaS
Problem: Customers churn after 3–6 months. This specific pattern usually means users reached activation but never deeply adopted the product. They used one feature, got partial value, and eventually stopped renewing when the contract ended. This is a feature adoption failure, not a product failure.
Problem: Involuntary churn is being ignored. Involuntary churn customers who leave because of failed payments, expired cards, or billing errors are separate from customers who choose to leave. Many SaaS companies lose 20–40% of their churn to this cause and do not know it because they lump it together with voluntary churn in their dashboards.
Problem: Tracking logo churn only, not revenue churn. A customer can stay active (logo retained) but downgrade from a $50,000 contract to a $10,000 contract. Your logo retention looks fine. Your Net Revenue Retention (NRR) is quietly collapsing. Always track both.
Problem: No early warning system for at-risk accounts. By the time a customer tells you they are leaving, it is usually too late to save them. The signals appeared 60–90 days earlier in the product data, declining login frequency, fewer features used, and support tickets going unanswered.
How to fix it
- Run a churn diagnosis before building any retention program. Identify what percentage of churn comes from: never activated, partial adoption, pricing, competition, or involuntary. The fix is completely different for each cause.
- Build a Customer Health Score combining login frequency, feature usage depth, support engagement, and NPS responses. Flag accounts that drop below a threshold 60 days before renewal.
- For involuntary churn, implement a payment recovery flow immediately. Tools like Chargebee and Paddle include automated dunning management that recovers failed payments without requiring manual intervention.
- Track NRR alongside GRR. Target: 90%+ Gross Revenue Retention, 110–120%+ Net Revenue Retention. Companies with an NRR above 120% grow revenue from their existing customer base even with zero new sign-ups.
Key Retention metrics to track
- Monthly churn rate (target: below 2% for SMB SaaS)
- Gross Revenue Retention GRR (target: 90%+)
- Net Revenue Retention NRR (target: 110–120%+)
- Customer Lifetime Value (CLV)
- Feature adoption rate for 3 core features
To understand the full financial impact of leaking revenue across billing and contracts, read our detailed post on revenue leakage in SaaS and how to fix it.
Stage 4 ➞ Referral: Why Your Customers Are Not Sending You New Business
Referral happens when users love your product enough to recommend it without being asked. When this stage works well, it is the lowest-CAC growth channel you have. When it is broken, it usually means retention is also broken. Satisfied customers refer; dissatisfied ones do not.
The most common Referral problems in B2B SaaS
Problem: You have no referral program at all. Many B2B SaaS teams wait for organic word-of-mouth and call it a referral strategy. They are leaving qualified leads on the table every month from customers who would refer if they had a simple, frictionless way to do it.
Problem: NPS is low, and nobody is acting on it. NPS is only useful if you close the loop. Sending an NPS survey, getting a score of 32, and doing nothing with the detractor responses is worse than not running NPS at all. Detractors who never hear back become public complainers.
Problem: Referral incentives are too weak or too complex. A referral program that pays out after 90 days, requires the referee to be on a specific plan, and delivers rewards in credits nobody uses will generate zero referrals. Complexity kills participation.
How to fix it
- Build a referral program only after retention is strong. A referral program on top of a poor product just accelerates churn. Fix Stage 3 first.
- Make sharing frictionless. The best referral mechanics work like Dropbox and Slack — they are embedded in the product and require one click. Use tools like Rewardful or Ambassador to manage this without building from scratch.
- Close the NPS loop within 48 hours. For promoters (9–10), ask for a referral or a G2/Capterra review. For detractors (0–6), get on a call within 72 hours. This alone can recover accounts before they churn.
- In B2B SaaS, case studies and co-marketing with satisfied customers often work better than referral links. A named customer success story on your website is a referral that works indefinitely.
Key Referral metrics to track
- Net Promoter Score: NPS (target: 50+ is excellent, 70+ is world-class)
- Referral conversion rate
- Number of referral invites sent per month
- Percentage of new customers from the referral channel
Stage 5 ➞ Revenue: Why You Are Not Monetizing What You Have Built
Revenue is the final accountability check. All the acquisition, activation, retention, and referral work means nothing if you are not monetizing effectively. In B2B SaaS, poor revenue performance usually traces back to three specific failures: wrong pricing model, weak upsell motion, or poor alignment between marketing, sales, and product.
The most common Revenue problems in B2B SaaS
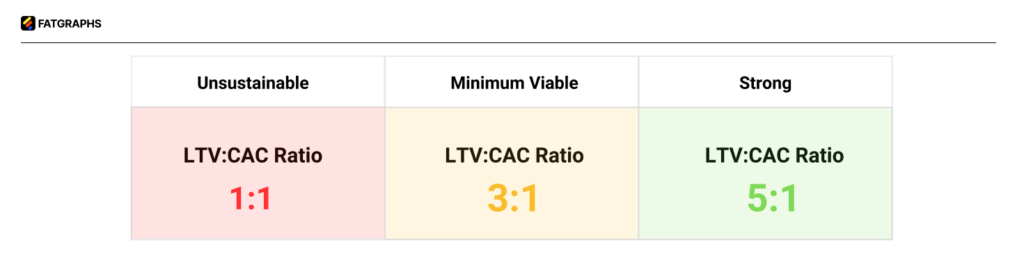
Problem: LTV: CAC ratio is below 3:1. This is the clearest sign that your business model is not sustainable. You are spending more to acquire customers than those customers are worth over time. This can come from high CAC, short customer lifetimes, or low ARPU, and each requires a different fix.
Problem: No expansion revenue motion. Most early-stage SaaS teams focus exclusively on new customer revenue. They ignore the existing customer base as a growth channel. But companies with strong Net Revenue Retention grow revenue from their existing base even without a single new sign-up. Upsells, seat expansions, and add-ons should be a dedicated revenue line, not an afterthought.
Problem: Pricing is set by cost or by gut feel. Most SaaS founders price by asking “what can we charge without losing deals?” instead of “what is the measurable value we deliver to the customer?” Value-based pricing in SaaS charging based on the outcome you create, not your costs, consistently generates higher ARPU and stronger retention because customers feel the price is justified by the result.
How to fix it
- Calculate your LTV: CAC ratio by segment. A 3:1 ratio is the minimum. 5:1 is strong. If you are below 3:1, the fix depends on which side is the problem. High CAC requires acquisition channel optimization; low LTV requires pricing or retention work.
- Build an expansion revenue playbook. Identify the top 20% of your customer base by engagement. These accounts are candidates for upsell. Assign a defined trigger (hitting a usage threshold, team growth, or adding a second business unit) that prompts a proactive outreach from your customer success team.
- Review pricing annually against actual customer outcomes. Survey your best-retained customers on the measurable value they get. If customers are saving $50,000 a year and paying $5,000, you almost certainly have room to grow ARPU without increasing churn.
- Track SaaS pipeline metrics at every stage so revenue forecasting is accurate, not based on gut feel about what is likely to close.
Key Revenue metrics to track
- Monthly Recurring Revenue (MRR) and MRR growth rate
- Annual Recurring Revenue (ARR)
- Average Revenue Per User (ARPU)
- LTV: CAC ratio (target: 3:1 minimum, 5:1 strong)
- Net Revenue Retention (NRR)
- Expansion MRR from existing customers
For a complete picture of the metrics that drive B2B SaaS revenue, read our guide on the most important B2B SaaS metrics.
Should You Follow AARRR Order? Or Start With Retention?
Here is a counter-intuitive point that most AARRR guides skip: for most B2B SaaS companies, starting with Acquisition is the wrong move.
The order in the acronym does not mean the order you should fix things. If your product has a retention problem, building your acquisition faster just fills a leaking bucket. You acquire 100 users, 60 churn within 90 days, and your CAC becomes impossible to recover.
Use this decision rule:
- If you are pre-product-market fit, start with Activation. Find what makes users stay, then build acquisition around that signal.
- If retention is below 85% GRR, fix Retention before spending more on Acquisition. Every new customer you add will leak at the same rate as the current ones.
- If retention is strong (90%+ GRR), then scale Acquisition aggressively. Your unit economics can support it.
This reordering is sometimes called the RARRA framework (Retention, Activation, Referral, Revenue, Acquisition), a variation introduced to address exactly this issue. RARRA is not a replacement for AARRR. It is a reminder of where to start if your current metrics show weakness in the middle of the funnel.
The Right Tools for Tracking AARRR in B2B SaaS
You do not need a complex tech stack. You need reliable data at each stage.
| Stage | Recommended tool | What to track |
|---|---|---|
| Acquisition | Google Analytics 4 | NPS score, referral conversion rate, and invites sent |
| Activation | Mixpanel or Amplitude | Activation event completion rate, time-to-value |
| Retention | PostHog or Amplitude | Cohort retention curves, churn flags, NRR |
| Referral | Rewardful + NPS tool | NPS score, referral conversion rate, invites sent |
| Revenue | Chargebee or Stripe + CRM | MRR, NRR, LTV: CAC ratio, expansion MRR |
One critical rule: validate your activation metric leads to better retention before making large decisions based on it. Run a cohort analysis comparing users who completed your chosen activation event versus those who did not. If retained users have a 40%+ higher completion rate for that event, you have confirmed the right metric.
How to Implement the AARRR Framework in 7 Steps
| Step | Action | Description | Example |
|---|---|---|---|
| 1 | Define One Metric Per Stage | Focus on one core metric per AARRR stage to avoid noise and improve clarity | Acquisition: Qualified leads/month; Activation: onboarding completion; Retention: MAU; Referral: invites/user; Revenue: revenue/account |
| 2 | Identify the Bottleneck | Find the single stage limiting growth and prioritize fixing it first | Low activation, high churn, weak referrals, poor onboarding |
| 3 | Map the User Journey | Document the full path from visitor to advocate including all touchpoints and drop-offs | Visitor → User → Customer → Advocate |
| 4 | Set Target Benchmarks | Define performance targets so metrics become actionable instead of just data | Activation 30–40%, churn <5%, referral 10–20% |
| 5 | Run Weekly Experiments | Continuously test improvements across funnel stages to drive compounding growth | Landing pages, onboarding flows, pricing, emails, referrals |
| 6 | Fix Retention First | Ensure users stay before scaling acquisition to avoid wasted spend | Prevent leaky bucket growth |
| 7 | Build a Growth Dashboard | Track all five stages in one place with daily visibility for decision-making | Single dashboard with 5 core metrics |
Not sure which AARRR stage is breaking your growth?
Fatgraphs works with B2B SaaS founders to identify exactly where MQL quality drops, what is wasting acquisition budget, and which stage of the funnel is blocking revenue growth. We map your acquisition system and show you where to focus first.
Conclusion
The AARRR framework is not a theory. It is a diagnostic tool. Every growth problem in a B2B SaaS company maps to one of these five stages. When you know which stage is broken, you stop guessing and start fixing the right thing.
The most important takeaways from this guide:
- Do not start with Acquisition if Retention is below 85% GRR; fix the leak first
- Define your activation event using real retention data, not assumptions
- Track NRR separately from logo churn; they tell completely different stories
- Close every NPS loop within 48 hours; it prevents churn and generates referrals
- Price based on the value you deliver, not on what competitors charge
Pick the stage with your worst metrics right now. Go through this guide’s fix section for that stage. Implement one change. Measure it. Then move to the next.
That is how the AARRR framework actually works in practice, not as a model you read once, but as a system you run continuously. For a deeper understanding of the metrics that sit behind each AARRR stage, read our guide on B2B SaaS marketing KPIs that actually move revenue.
Frequently Asked Questions
What does AARRR stand for?
AARRR stands for Acquisition, Activation, Retention, Referral, and Revenue. It is a five-stage growth framework for startups and B2B SaaS companies, created by Dave McClure in 2007. Each letter represents a stage in the customer lifecycle and a set of metrics that measure whether that stage is working.
Why is the AARRR framework called Pirate Metrics?
Because saying the acronym out loud, “AARRR,” sounds like a pirate. Dave McClure introduced it at a 2007 presentation, and the name stuck. Beyond the joke, the name reflects the scrappy, metrics-first mindset the framework encourages: stop celebrating vanity metrics and focus on what actually drives growth.
Should B2B SaaS companies start with Acquisition or Retention?
Most B2B SaaS companies should fix Retention before scaling Acquisition. If your gross revenue retention is below 90%, adding more users just accelerates the churn problem. Identify why customers leave first. Once retention is stable, acquiring users at scale makes economic sense because your LTV: CAC ratio can support the spend.
What is the difference between AARRR and RARRA?
RARRA reorders the five stages to Retention, Activation, Referral, Revenue, Acquisition. It was created to address the fact that most early-stage SaaS companies fail due to poor retention, not poor acquisition. RARRA is not a replacement for AARRR. It is a reminder that for companies with weak middle-of-funnel metrics, fixing retention and activation delivers more value than scaling acquisition.
How many AARRR metrics should I track per stage?
Track 2–3 metrics per stage, maximum at any one time. The goal is not comprehensive measurement; it is actionable insight. More metrics create noise. Pick the one primary metric per stage that most directly reflects the health of that stage (for example, monthly churn rate for Retention, activation event completion rate for Activation) and track it consistently over time before adding secondary metrics.
What tools should I use to track AARRR metrics?
For most B2B SaaS teams: Google Analytics 4 for Acquisition, Mixpanel or Amplitude for Activation and Retention, a dedicated NPS tool for Referral, and Chargebee or Stripe combined with your CRM for Revenue. PostHog is a strong option if you want one platform to cover Activation and Retention together with full customization.