 Book Call with Haroon
Are your SaaS pipeline metrics giving you a clear picture of your revenue trajectory, or are you flying blind? SaaS metrics are the key performance data that SaaS companies monitor to measure growth, retention, and customer satisfaction over time. Common saas metrics like customer churn and lifetime value get plenty of attention. Your pipeline metrics reveal whether you’re on track to hit revenue targets.
You need to know which key saas metrics to track and how to measure them. Discover the most important saas metrics for your pipeline. You’ll learn practical tracking methods and proven strategies to optimize conversion rates at every stage of your sales process.
What are SaaS pipeline metrics?
SaaS pipeline metrics are the key performance indicators that measure health and efficiency within your sales cycle. These metrics track how qualified opportunities move through your sales funnel and generate revenue. Pipeline metrics answer specific operational questions that general performance indicators don’t: How many qualified opportunities sit in your pipeline? How fast do deals move from one stage to the next? Where are the biggest drop-offs happening? How much revenue is likely to close this quarter versus next?
Importance of pipeline metrics for SaaS companies
- Pipeline metrics provide visibility into how your sales pipeline performs. This sharpens forecasting accuracy and gives you a clearer picture of whether revenue targets are within reach.
- These KPIs highlight bottlenecks that your reps might not notice and create opportunities to optimize sales activities and provide targeted coaching.
- Pipeline metrics often serve as better indicators of health and performance than revenue growth alone, especially for early-stage SaaS startups.
- Annual recurring revenue grows in fits and starts for companies with higher annual contract values and longer sales cycles. Then, once it’s clear that recurring revenue growth has stalled, turning things around may be too late.
- SaaS pipeline metrics function as leading indicators of performance. They help you project more accurately, guide sales hiring, optimize prospecting, and even rework your ideal customer profile.
How SaaS pipeline metrics differ from other SaaS metrics
The difference between pipeline metrics and other saas company metrics centers on timing. Revenue closed today, this week, or this quarter represents lagging indicators. But pipeline health functions as a KPI that corresponds to the level of income you can predict into the future based on historic sales cycles and a proven sales process that has shown fulfillment.
The relation between pipeline health and revenue growth
Companies with structured pipeline management practices see 28% higher revenue growth. This direct correlation between effective sales pipeline management and strong revenue growth stems from accurate forecasting and better resource allocation. Many companies fail to manage their pipeline because they don’t learn or respond adequately to it. They miss excellent sales opportunities and struggle to identify priorities.
A healthy pipeline makes sales teams have a more accurate view of potential deals to close in the coming months, spot bottlenecks, and bring deals to fruition. As you track results over time, you see how changes in the sales process contribute to revenue growth overall.
Key SaaS pipeline metrics you should track
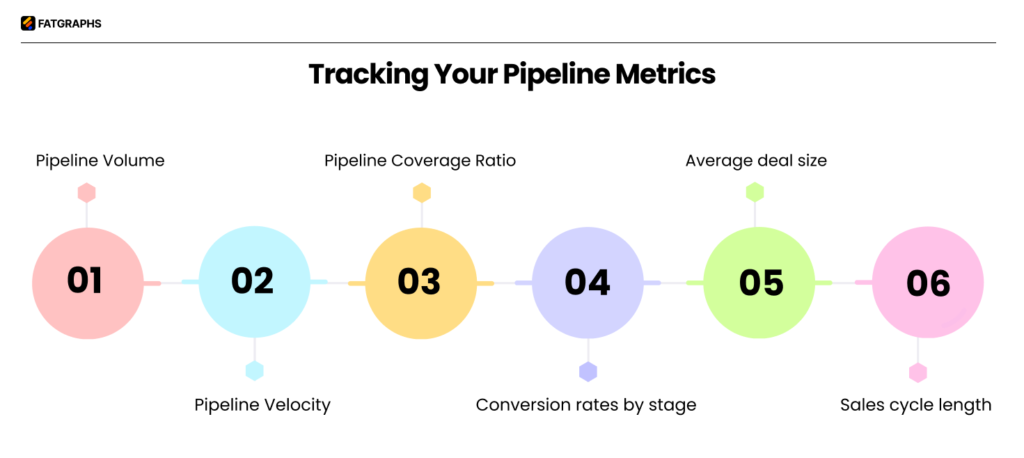
Six core SaaS pipeline metrics reveal whether your sales pipeline will deliver the revenue you need. Each metric tracks a different dimension of pipeline health, from volume to speed to quality.
1- Pipeline volume
Pipeline volume represents the sum of all open deals in your pipeline. B2B SaaS companies maintain a pipeline volume between 3-5x their quarterly revenue target. This total value sets your maximum revenue potential, though the actual amount you’ll close depends on conversion rates and deal progression through each stage.
2- Pipeline velocity
Pipeline velocity tracks how quickly deals move through your pipeline and convert into revenue. The formula integrates four dimensions:
(Number of Opportunities × Average Deal Size × Win Rate) ÷ Sales Cycle Length
50 deals at $25,000 average deal size with a 20% win rate and 90-day sales cycle produces $2,778 per day in pipeline velocity. This metric reveals the speed at which your revenue engine generates bookings.
3- Pipeline coverage ratio
Your pipeline coverage ratio compares the value of qualified deals with your quota for that period.
Calculate it as Total Pipeline ÷ Sales Quota.
Your coverage ratio is 4x if your quarterly quota is $1 million and the total pipeline value is $4 million. Most organizations target coverage between 3x and 5x, though your ideal ratio depends on historical win rates.
4- Conversion rates by stage
Stage conversion rates track the percentage of deals advancing from one pipeline stage to the next. B2B SaaS standards show
- Discovery to Qualification converts at 60-70%
- Qualification to Proposal at 50-60%
- Proposal to Negotiation at 60-70%.
These rates pinpoint where deals stall in your process.
5- Average deal size
Average deal size equals Total Revenue ÷ Number of Closed Deals. The median annual contract value for private SaaS companies is $26,265. Deal size increases with company maturity and impacts profitability timelines.
6- Sales cycle length
Sales cycle length tracks time from deal creation to close. The average B2B SaaS cycle runs 84 days, though SMB deals under $5K close in 40 days while enterprise deals over $100K take 170+ days.
How to track and measure your pipeline metrics
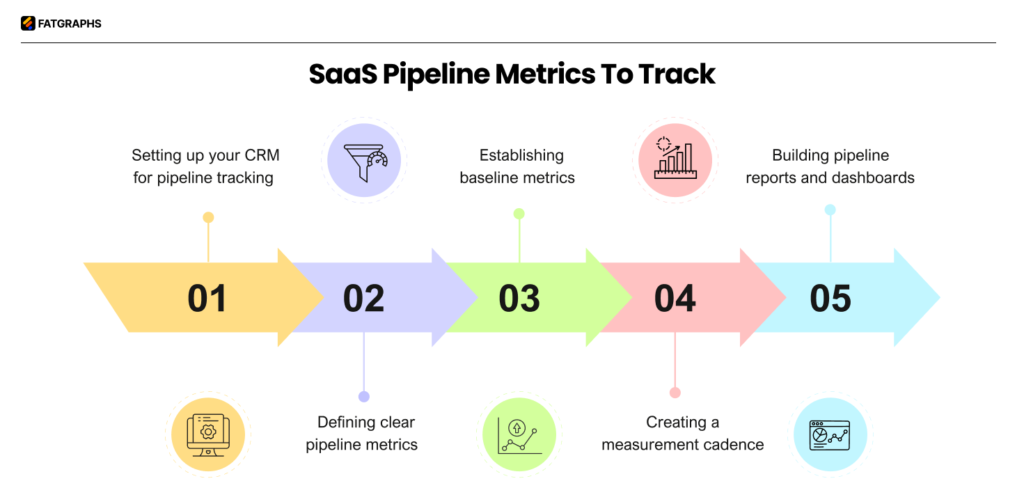
You need infrastructure that captures deal movement automatically and surfaces insights at the right moment to track SaaS pipeline metrics.
1- Setting up your CRM for pipeline tracking
Your CRM serves as the single source of truth for all pipeline data. Choose a platform that provides customizable pipeline stages, required fields at each stage, and integration with your email, calendar and sales engagement tools. CRMs like Salesforce, HubSpot, and Pipedrive allow you to define stage criteria and track movement, but they require strong data discipline. Set up custom field mapping to capture lead source, key pain points, and decision-makers involved. Automation claws back time by creating tasks at the time deals move through stages and rotating leads based on territory.
2- Defining clear pipeline stages
Each stage needs exit criteria. A prospect shouldn’t advance to the proposal phase unless you’ve identified a clear decision-maker and confirmed the budget. Standard stages include prospecting, qualification, discovery, proposal, negotiation, and closing. Define what must happen for a lead to exit each stage and move forward.
3- Establishing baseline metrics
Measure current conversion rates, cycle length, and deal values before you optimize. Pull historical data from the last 3-6 months to identify patterns. So you’ll understand whether conversion rate fluctuations represent real changes or normal variance.
4- Creating a measurement cadence
Track new opportunities added daily, lead response time daily, and total pipeline value weekly. Conduct pipeline reviews weekly with your sales team to update deal stages and identify stalled opportunities. Analyze conversion trends and win/loss reasons monthly.
5- Building pipeline reports and dashboards
Focus dashboards on metrics that influence revenue directly, not unnecessary data points. Balance 60% leading indicators for management with 40% lagging indicators for performance accountability. Role-specific dashboards give reps, managers, and executives relevant metrics with drill-down capabilities.
Best practices for improving pipeline performance
Improving your saas performance requires targeted action on the specific stages where deals slow down or fall apart.
Identifying and fixing bottlenecks
Map how long deals spend at each pipeline stage to detect where dwell time spikes. Companies that automate bottleneck alerts experience a 20% faster cycle from identification to remediation than manual oversight. Focus on stages with the lowest conversion rates. A 10% improvement in your weakest stage delivers more effect than a 2% improvement in any stage. Track stage conversion rates by segment, team, and rep to identify friction points in your funnel.
Optimizing conversion rates between stages
Stage conversion analysis reveals where prospects get stuck. Monitor conversion trends monthly and compare opportunities that converted through problematic stages to identify patterns. Marketing should generate qualified leads through targeted content, resulting in a 20% increase in sales opportunities compared to non-nurtured leads.
Improving lead quality and qualification
Use the BANT framework (Budget, Authority, Need, Timeline) combined with behavioral indicators like engagement levels and revenue potential to qualify leads. Marketing and sales should arrange around shared qualification criteria to reduce wasted effort on low-quality prospects.
Using predictive analytics for pipeline forecasting
AI-driven forecasting reduces errors by 20-50%. Organizations using predictive analytics see 10-15% higher conversion rates and 10-20% reduction in sales cycle length. Segment forecasts by revenue type and sales motion. Update predictions weekly to reflect pipeline shifts.
Conclusion
Pipeline metrics give you the forward visibility that revenue numbers alone can’t provide. Track the right metrics and act on what they reveal. You’ll spot problems before they tank your quarterly targets.
Establish baseline measurements for your six core metrics first. Focus your optimization efforts on the stages with the lowest conversion rates after that. Companies that become skilled at pipeline management see higher revenue growth. They can forecast with precision and allocate resources where they matter most.