 Book Call with Haroon
Trying to figure out if your startup is really growing? You’re not the only one. A lot of people feel confused when they look at their numbers. That’s where the AARRR framework helps. It’s a simple way to understand what users are doing and if your business is moving forward. Many founders focus on numbers that look good but don’t help much. Things like lots of website visits, many views, or more followers. These numbers may look impressive, but they don’t always show real progress.
The AARRR funnel, also called Pirate Metrics, helps you focus on what actually matters. Instead of guessing, it shows how people move through your product step by step. The framework has five stages: Acquisition, Activation, Retention, Referral, and Revenue. These steps show the full journey of a user, from finding your product to paying for it.
So, what exactly is the AARRR framework?
Think of AARRR as a step-by-step way to see how users move through your product. It starts from the first time they find you and ends when they become paying customers (and maybe even tell others about you).
The framework was created by Dave McClure, the founder of 500 Startups, in 2007. Since then, many startups have used it because it focuses on real growth, not just numbers that look good but don’t mean much.
The 5 Stages of the AARRR Framework
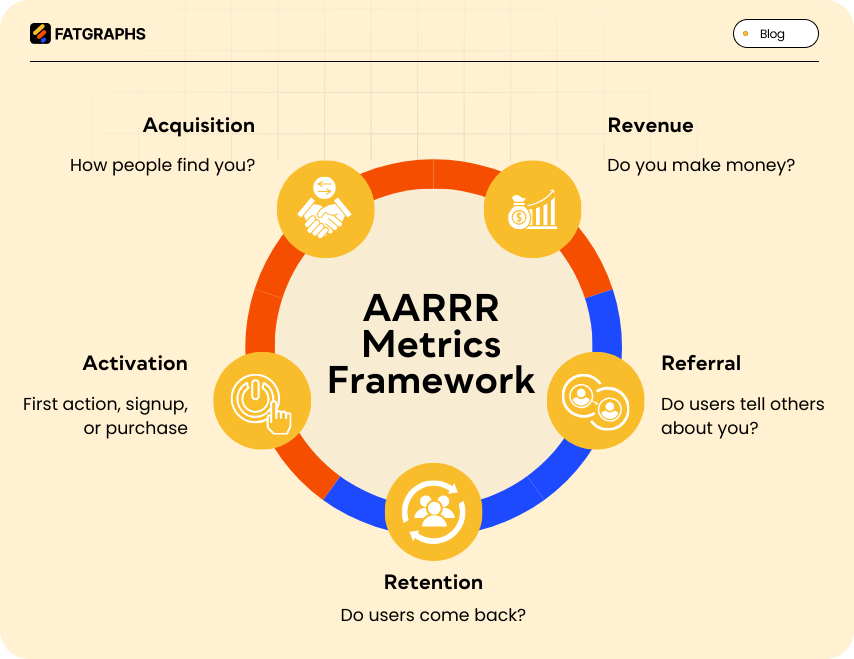
The framework breaks the customer journey into five very specific stages:
Acquisition
This is all about how people find you. SEO, content, social media, paid ads, partnerships, anything that brings users into your world lives here.
Activation
Activation is when users first experience value. The famous “aha moment.”
For a SaaS product, that might be completing onboarding or using a core feature. For e-commerce, it could be the first purchase.
Retention
This is where things get serious. Retention tells you whether users actually stick around. Since acquiring new users can cost 5–25x more than keeping existing ones, this stage is critical.
Referral
When users are happy enough to tell others about your product, you’ve unlocked referrals. Strong referral metrics usually mean strong product-market fit.
Revenue
Finally, revenue answers the big question: Are you making money? This stage tracks how effectively you monetize through subscriptions, upgrades, pricing strategies, or add-ons.
Why is it called “Pirate Metrics”?
Because saying A-A-R-R-R sounds like a pirate yelling “AARRR!” 🏴☠️
That’s literally it.
But beyond the fun name, the AARRR Framework reflects a scrappy, entrepreneurial mindset focused on what matters, measuring everything that counts, and moving fast with clarity.
How AARRR works as a funnel
At its heart, AARRR is a growth funnel. It shows you exactly where users are dropping off and where your biggest opportunities are.
For example:
- If acquisition and activation look great but retention is weak, you know the product isn’t sticky.
- If retention is strong but revenue is weak, your pricing or monetization needs work.
Once you track these metrics over time, AARRR becomes an early warning system. The moment something shifts, good or bad, you’ll see it.
Where do AARRR metrics come from?
Dave McClure created this framework after watching founders drown in dashboards full of meaningless numbers. At the core, his belief was simple: solve a real problem, monetize it, and make sure you earn more than you spend. He noticed startups celebrating metrics that didn’t actually drive growth. So he built AARRR with two goals in mind:
- Help startups focus only on metrics tied to real business health
- Give founders clear data to evaluate marketing, product, and monetization decisions
Problems the AARRR Framework Solves for Startups
The AARRR framework completely changes how startups measure success. It helps you:
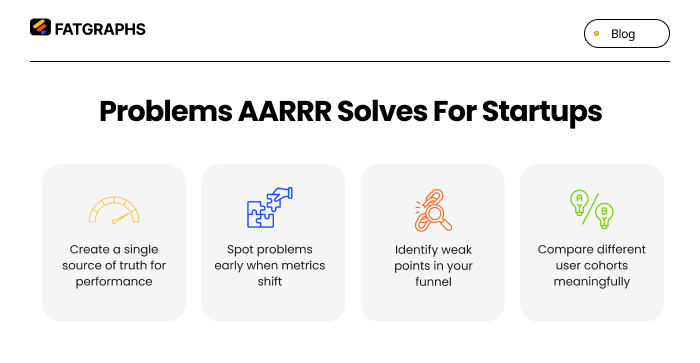
Most importantly, it helps validate whether your business model is actually worth scaling.
AARRR vs Vanity Metrics
Here’s the key difference.
Vanity metrics look impressive, but don’t change decisions.
Think: page views, impressions, follower counts, email list size.
AARRR metrics, on the other hand, are actionable. They’re directly tied to growth, revenue, and retention. The framework also encourages a smarter product mindset: spend 80% of your effort improving what already exists and only 20% building new features. Instead of chasing traffic, you focus on proving real user value.
Breaking down the AARRR funnel (stage by stage)
Let’s look at each stage of the AARRR Framework in practical terms.
Acquisition: How Users Find You
This stage measures where users come from and how efficiently you attract them.
Key metrics include:
- New signups
- Qualified leads
- Customer Acquisition Cost (CAC)
Channels usually include SEO, content marketing, paid ads, social media, partnerships, and referrals. The goal isn’t just traffic, it’s high-quality users.
Activation: First Real Value
Activation happens when users experience your product’s value for the first time.
Important metrics here:
- Activation rate
- Time-to-value
- Free-to-play conversion rate
Great activation usually comes from strong onboarding, clear messaging, and removing friction early on.
Retention: Keeping Users Around
Retention tells you whether users come back.
Key metrics include:
- Retention rate
- Churn rate
- Customer Lifetime Value (CLV)
Strong retention comes from personalization, continuous improvements, fast support, and making your product genuinely useful over time.
Referral: Users Spreading the Word
Referrals happen when users love your product enough to recommend it.
Metrics to watch:
- Net Promoter Score (NPS)
- Number of invites sent
- Referral conversion rate
The best referral programs make sharing effortless and rewarding for both sides.
Revenue: Monetizing Effectively
Revenue is the final accountability check.
Key metrics include:
- Monthly Recurring Revenue (MRR)
- Net Revenue Retention (NRR)
- Average Revenue Per User (ARPU)
Successful companies constantly refine pricing, packaging, and upsell strategies to increase customer value.
How to Actually Implement AARRR Metrics
Understanding the framework is step one. Implementation is where the real work begins.
Choosing the right tools
You’ll need the right analytics stack:
- Google Analytics for acquisition
- Mixpanel or Amplitude for product behavior
- Hotjar for session recordings and UX insights
- PostHog for customizable AARRR tracking
Always validate that your activation metric leads to better retention before making big decisions on it.
A/B testing at every stage
Testing is essential across the funnel, landing pages, onboarding, pricing, and referral flows.
Focus on one or two metrics at a time. Don’t try to optimize everything at once. And remember McClure’s rule: improve what exists before building something new.
Using data to improve product and marketing
Once data is flowing, look for drop-offs and patterns:
- Where do users leave?
- Which channels underperform?
Combine quantitative data with qualitative insights like user interviews and session replays. Roll out changes gradually using feature flags before committing fully.
Common mistakes to avoid
Some classic AARRR mistakes:
- Obsessing over acquisition and ignoring retention
- Making decisions based on assumptions
- Ignoring user feedback
- Chasing short-term wins instead of long-term growth
Conclusions
The AARRR framework isn’t just a metrics model; it’s a growth mindset. It helps you stop guessing, stop celebrating empty numbers, and start focusing on what actually drives a healthy business. Once you implement it, you’ll clearly see where to invest your time, money, and energy. Maybe your activation needs work. Maybe retention is the real issue. Or maybe monetization is lagging behind engagement.
AARRR shows you exactly where to look. Yes, it takes time and consistency to track all five stages properly. But the payoff is huge: better decisions, smarter growth, and a business built on real user behavior, not assumptions. If you’re building or scaling a startup, Pirate Metrics gives you a clear map. And if you follow it well, the destination of a sustainable, data-informed business is absolutely worth the journey.