 Book Call with Haroon
Customer acquisition cost has become the metric that separates SaaS companies that scale from those that stall. In 2026, acquiring a B2B SaaS customer costs more than it ever has, and the gap between efficient operators and everyone else keeps widening. This guide cuts through the noise to give you what matters: what drives your SaaS CAC Benchmarks, how to benchmark it honestly, and what levers actually move the number.
What Is CAC in SaaS?
Customer acquisition cost (CAC) is the total sales and marketing spend divided by the number of new customers acquired in a given period. Simple in theory, but increasingly difficult to manage in practice.
For most B2B SaaS companies, CAC has climbed steadily through 2024 and 2025. Paid advertising costs rose across every major platform. Sales cycles lengthened. Privacy regulations made targeting less precise. The result is that companies are spending more to bring in the same or fewer customers.
What matters isn’t the number in isolation. CAC only becomes meaningful when you pair it with how long customers stay and how much they spend. A high CAC can be entirely rational if the lifetime value (LTV) is high enough. A low CAC can quietly destroy a business if customers churn in six months.
SaaS CAC Benchmarks by Industry
Not all SaaS companies face the same acquisition challenge. Your industry vertical shapes your baseline CAC more than almost any other factor.
HR Tech
Tends to have the lowest acquisition costs among B2B SaaS categories. Buyers are often familiar with the buying process, the product category is well-understood, and self-serve or product-led motions can work effectively. If your CAC is creeping above what a short sales cycle should justify, that’s a signal worth investigating.
Cybersecurity
Sits in the middle tier. Security purchases typically require buy-in from stakeholders across IT, legal, and procurement. Longer evaluation periods and competitive displacement cycles inflate costs. Companies in this space should pay close attention to sales efficiency metrics, not just top-of-funnel volume.
Fintech
Companies face the steepest challenge. Regulatory complexity, trust barriers, and intense competition from both incumbents and venture-backed challengers make customer acquisition expensive. If you’re operating in fintech, comparing yourself to a general SaaS CAC benchmark will give you a false read. You need fintech-specific targets.
The broader B2B SaaS range spans from a few hundred dollars to several thousand per customer, depending on your segment, deal size, and sales model. The most useful SaaS CAC Benchmarks is always within your vertical and stage, not across the industry.
CAC by Company Stage: What to Expect
Where you are in your growth journey dramatically affects what “normal” CAC looks like and what’s sustainable.
Early-stage companies (typically pre-$5M ARR) often have higher CAC because they haven’t yet optimized their go-to-market motion. They’re still learning which channels work, which messages resonate, and which customer segments convert efficiently. Higher CAC at this stage is acceptable if you’re using it to learn, not just to grow.
Growth-stage companies are scaling into new segments, hiring sales teams, and running more complex marketing programs. CAC naturally climbs here, but it should be climbing in proportion to deal size. If the average contract value isn’t growing alongside CAC, the unit economics are deteriorating.
Enterprise-focused companies carry the highest absolute CAC numbers, often by a significant margin over SMB-focused peers. That’s not a problem if your contracts are large and your retention is strong. Enterprise buyers involve multiple stakeholders, longer procurement timelines, and extensive evaluation periods, all of which cost money to navigate.
Self-Serve vs. Sales-Led: The Model That Sets Your CAC Floor
Your acquisition model sets a floor on what CAC can realistically be.
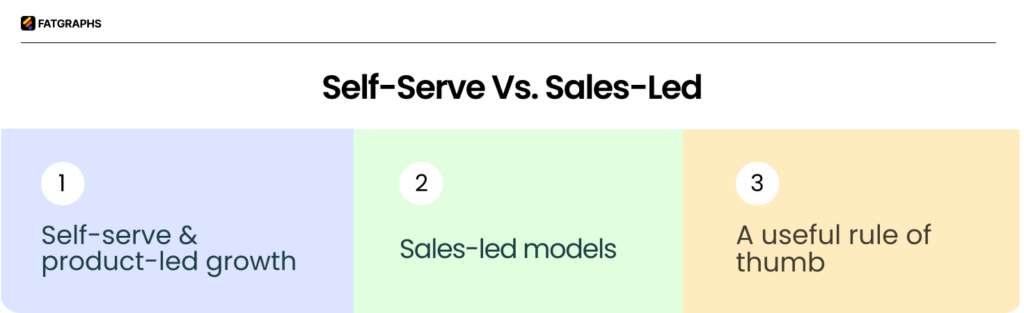
Self-serve and product-led growth (PLG)
Companies have fundamentally different economics than sales-led ones. When users can discover, trial, and convert without speaking to a human, acquisition costs compress. The trade-off is that these models require significant investment in product experience, onboarding, and activation. CAC is lower, but the product itself is doing the selling.
Sales-led models
Require account executives, sales engineers, marketing programs, and often lengthy nurture sequences. The economics only work if the deal size justifies the spend. This is why annual contract value (ACV) is the anchor metric for whether a sales-led CAC is defensible.
A useful rule of thumb
Your CAC should be recoverable within the first year of the customer relationship. If you’re spending more to acquire a customer than you earn from them in 12 months, you’re funding growth with capital rather than revenue, which is fine for a period, but unsustainable as a long-term model.
The Metrics That Matter More Than CAC Alone
LTV to CAC Ratio
The ratio of customer lifetime value to acquisition cost is the most important lens for evaluating whether your CAC is sustainable. A 3:1 ratio is widely cited as the standard target: for every dollar you spend acquiring a customer, you should earn three dollars back over their lifetime.
What the ratio tells you at different levels:
| Below 2:1 | You’re spending too much relative to what customers are worth, or customers aren’t staying long enough. Investigate both. |
| Around 3:1 | Healthy and scalable. You have room to invest in growth. |
| Above 4:1 | Highly efficient, but consider whether you’re underinvesting in acquisition. Being too conservative with sales and marketing spend in a competitive market can cost you market share. |
Early-stage companies can operate at lower ratios while finding product-market fit. As you mature, the expectation rises.
CAC Payback Period
Payback period how many months it takes to recover what you spent to acquire a customer, is the most operationally useful CAC metric. It tells you how quickly your cash comes back.
For B2B SaaS, recovering acquisition costs within 12 months is generally considered healthy. The best-performing companies do it faster. Consumer-facing SaaS typically sees quicker payback because price points are lower and activation is faster.
If your payback period is stretching beyond 18 months, dig into why. It could be rising CAC, weak conversion from trial to paid, poor activation, or early churn, each of which has a different fix.
The CAC Ratio (Sales & Marketing Spend per $1 of New ARR)
A less-discussed but highly practical metric: how much you spend in sales and marketing for every dollar of new annual recurring revenue you generate. Industry benchmarks suggest that spending around $1–2 to generate $1 in new ARR is a reasonable range. Companies consistently spending more than $2 for every dollar of ARR are often signaling structural inefficiency in their go-to-market.
Why CAC Has Gone Up, and Likely Won’t Come Down
Understanding the forces behind rising CAC helps you make smarter decisions about where and how to compete.
Paid channel costs keep rising
Every major advertising platform, search, social, and professional networks have seen cost increases as more SaaS companies compete for the same audiences. More bidders chasing finite inventory means higher prices for everyone. This isn’t cyclical. It’s structural.
Targeting is less precise
Privacy regulations and platform policy changes have reduced the ability to reach highly specific audiences with behavioral data. Ads reach broader, less qualified audiences. Conversion rates drop. Cost per acquisition climbs even if click volume holds steady.
Sales cycles are longer
The average B2B SaaS sales cycle has stretched considerably over the past few years. More stakeholders are involved in purchase decisions, budgets face more scrutiny, and buyers take longer to move from evaluation to contract. Every additional touchpoint costs money.
Attribution has gotten harder
Cookie deprecation and walled-garden platforms make it difficult to accurately measure which channels are actually driving revenue. Companies flying blind tend to over-invest in bottom-of-funnel channels they can measure and under-invest in awareness channels they can’t often at the expense of long-term pipeline health.
How to Actually Lower Your CAC
Reducing CAC isn’t about cutting spend. It’s about improving the return on what you’re already spending.
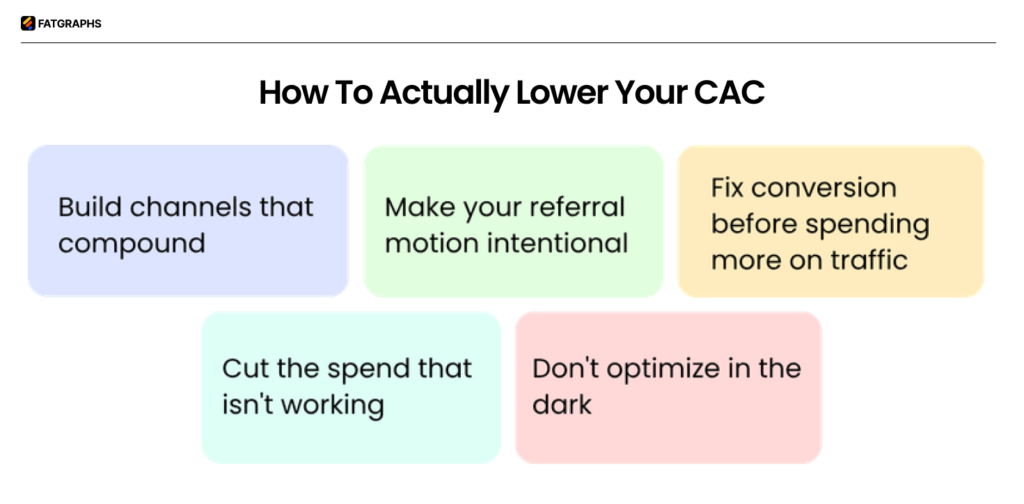
1- Build channels that compound
Organic search, content marketing, and community take time to build, but don’t have the same cost-per-click economics as paid channels. Once they’re working, they continue generating demand without proportional ongoing investment.
2- Make your referral motion intentional
Referred customers typically convert faster, cost less to acquire, and stay longer. If you don’t have a structured referral program, you’re leaving one of the most cost-efficient acquisition channels on the table. The mechanics don’t need to be complex; a well-designed two-sided incentive and a simple activation flow are enough to get started.
3- Fix conversion before spending more on traffic
Most CAC problems aren’t traffic problems; they’re conversion problems. More visitors won’t help if your trial experience is confusing, your demo request flow has friction, or your sales team is slow to follow up. Improving conversion at any step of the funnel reduces effective CAC without touching ad spend.
4- Cut the spend that isn’t working
A meaningful share of marketing budget typically produces little measurable return. Regular audit of channel performance against actual revenue outcomes, not just leads or clicks, usually surfaces campaigns worth pausing.
5- Don’t optimize in the dark
Knowing which channels actually initiate and close customer relationships requires intentional attribution. Even imperfect multi-touch models give you better information than last-click alone.
Read More: How to reduce CAC?
What “Good” CAC Looks Like: A Practical Summary
There’s no single number that defines good CAC across SaaS. But some principles hold across segments:
Your CAC should be recoverable within 12 months in most business models, sooner if you’re an earlier-stage or cash-constrained. Your LTV to CAC ratio should clear 3:1 as you mature. Your CAC should grow in proportion to deal size rising CAC against flat ACV is a warning sign. And your most efficient acquisition channels are probably not your biggest budget items.
The companies that manage CAC well in 2026 aren’t necessarily spending less. They’re spending more intentionally, investing in channels that compound over time, and treating conversion optimization as an ongoing discipline rather than a one-time project.
Frequently Asked Questions
1- What is a good CAC for a B2B SaaS company?
It depends on your industry, stage, and deal size. The more useful question is whether your CAC is recoverable within a reasonable payback period, typically under 12 months, and whether your LTV to CAC ratio is at or above 3:1.
2- How do I calculate SaaS CAC?
Divide total sales and marketing spend in a given period by the number of new customers acquired in that same period. Be consistent about what you include in “sales and marketing spend” salaries, tools, ad spend, and events all count.
3- Why is my CAC going up even though my ad spend hasn’t changed?
Rising platform CPCs, lower targeting precision from privacy changes, and longer sales cycles all inflate CAC without any change to budget. You may also be experiencing diminishing returns as you’ve captured your most accessible audiences and are now reaching less qualified prospects.
4- What’s the difference between CAC and cost per lead?
Cost per lead measures marketing efficiency at the top of the funnel. CAC measures end-to-end acquisition efficiency, including all sales costs. Both are useful, but CAC is what connects to business economics.
5- Is a low CAC always good?
Not necessarily. A very low CAC can signal underinvestment in growth, a missed opportunity in competitive markets. It can also reflect the acquisition of small, low-value customers who churn quickly. Always read CAC alongside LTV and payback period.