 Book Call with Haroon
B2B SaaS companies grow by tracking the right numbers that show how their business is doing. Success doesn’t just come from getting new customers; it comes from keeping them, helping them use the product, and making sure the business earns steadily. Important B2B SaaS metrics show how many leads turn into customers, how often people use the product, and how much money each customer brings in.
Retention measures show if customers stay loyal and if there are problems to fix before they leave. By focusing on acquisition, engagement, revenue, and retention, companies can see what works and what needs improvement. Tracking these B2B SaaS metrics helps teams make smarter decisions, improve products, and spend resources wisely. Using clear data makes it easier to plan for growth, satisfy customers, and build a strong business that lasts over time.
Acquisition Metrics That Drive Growth
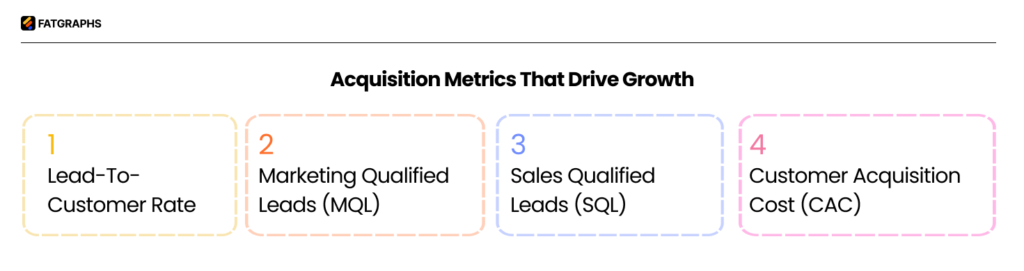
SaaS growth depends on acquisition metrics that are the foundations of your business success. These B2B SaaS metrics help you optimize marketing costs and make your sales approach more effective.
1- Lead-to-Customer Rate
Your lead-to-customer rate shows what percentage of qualified leads become paying customers. This basic metric evaluates how well your sales funnel works. You can calculate it by dividing new customers by total leads and multiplying by 100.
Research shows companies that use clear sales stages and conversion metrics grow revenue 30% faster than others. The average B2B SaaS lead-to-customer conversion rate ranges between 0.5-1.5%. Your rates falling below this number signal the need to get into your qualification process or sales approach.
SOURCE: Getmonetizely
2- Marketing Qualified Leads (MQL)
MQLs are prospects who show interest in your product through marketing interactions. These leads connect with your content but aren’t ready to buy yet. 63% of successful businesses use lead scoring to rank these leads.
Companies see better closing rates when their sales and marketing teams arrange MQL criteria together. So, your business needs a clear MQL definition to make marketing-sales teamwork productive.
3- Sales Qualified Leads (SQL)
SQLs move past marketing qualification and show clear buying intent. Your sales team checks these leads and confirms they’re ready for direct sales contact.
The BANT framework (Budget, Authority, Need, Timeline) helps you know if a lead is truly sales-ready. Companies with SQL qualification processes make more accurate forecasts. This makes the metric vital for predicting revenue.
4- Customer Acquisition Cost (CAC)
CAC reveals how much you spend to get a new customer. Add up your sales and marketing costs, then divide by the number of new customers you gained in that time.
To name just one example, spending $50,000 on marketing and sales in a quarter to gain 250 new customers gives you a CAC of $200. The best SaaS companies keep a CAC to LTV ratio of at least 1:3. This number tells you if your growth strategy works or if you’re spending too much to get customers compared to their lifetime value.
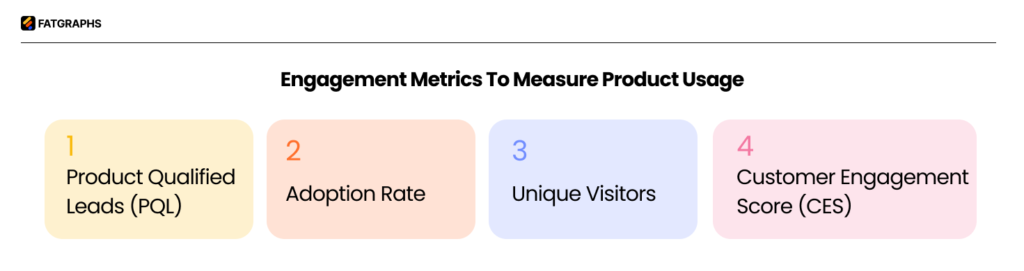
Engagement Metrics to Measure Product Usage
Customer engagement metrics show how users interact with your product, unlike acquisition B2B SaaS metrics that focus on new customers. Getting customers is just the first step. Their continued engagement determines your long-term success.
1- Product Qualified Leads (PQL)
Product Qualified Leads represent potential customers who discover your product’s value through free trials or limited features. These leads show buying intent through actual product usage, making them valuable assets. Research demonstrates PQLs convert at high rates, often between 15-30%. They convert eight times more frequently than Marketing Qualified Leads.
Users who watch product demos, share interactive demos with team leads, log in often, or hit specific usage thresholds make excellent PQLs. You can group them into three categories: hand-raisers eager to talk to sales, usage-based leads with high engagement, and needs-help leads in complex buying cycles.
2- Customer Engagement Score (CES)
Customer Engagement Score combines usage frequency, feature utilization depth, specific actions, and clickstream data into a single number. This score measures your customers’ product engagement level.
The main advantage? A quick look at one number tells you about customer interactions. You can predict renewals, spot upsell opportunities, and segment customers for targeted actions. To cite an instance, you might group customers scoring 80-100 who tend to renew more versus those scoring 1-40 with lower renewal rates.
3- Adoption Rate
The adoption rate shows what percentage of new users become active within a set timeframe. The calculation divides new active users by total new sign-ups. A simple example: 250 active users from 1,000 new sign-ups in 30 days equals a 25% adoption rate.
This metric affects customer lifetime value and predicts retention. Companies that cut time-to-first-value see adoption rates improve significantly.
4- Unique Visitors
Unique visitors count individual website visitors during a specific period, not just pageviews or sessions. This number helps measure marketing success, identify growth patterns, and calculate conversion rates accurately.
Visitor pattern analysis reveals seasonal changes and channel performance, helping you make evidence-based marketing decisions. You get a clear picture of your actual audience size and reach.
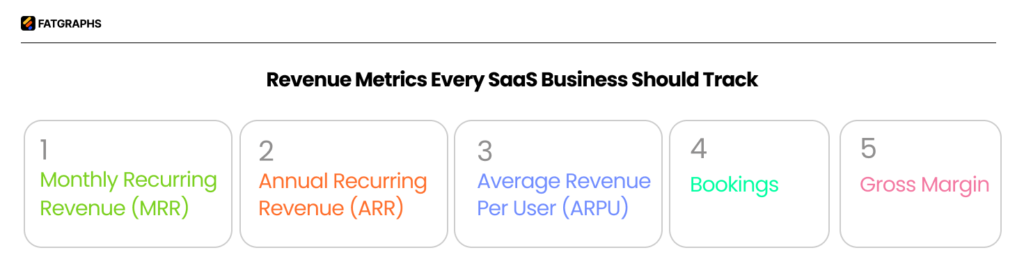
Revenue Metrics Every SaaS Business Should Track
Revenue metrics act as vital signs of your SaaS business’s financial health. They give you a clear picture of predictable income streams and growth patterns that help forecast future performance and guide strategic decisions.
1- Monthly Recurring Revenue (MRR)
MRR shows the normalized monthly subscription revenue your business generates. It’s your financial pulse. This metric helps you track monthly growth trends and project future earnings. SaaS businesses find MRR valuable because it creates a standard way to report revenue across different pricing plans and billing terms.
You can calculate MRR by multiplying your active customer count by their average monthly payment. Another approach adds up your subscription tiers (base, premium, enterprise) to get a detailed view. Just exclude one-time payments and normalize annual contracts properly.
2- Annual Recurring Revenue (ARR)
ARR tells you what predictable income to expect yearly from active subscriptions. B2B SaaS companies with multi-year agreements use ARR to see their year-over-year growth. Industry standards show median ARR growth rates typically range between 40-60%. Early-stage businesses tend to grow faster than mature companies.
Simple math shows ARR equals MRR times 12, though this works best with annual or multi-year subscriptions. Most companies use ARR to determine valuation, while MRR serves as an operational metric.
3- Average Revenue Per User (ARPU)
ARPU shows how much money each customer brings in on average. This number helps you fine-tune pricing strategies, spot growth opportunities, and understand customer segments better.
The calculation is easy: divide total revenue by active users. Higher ARPU means you’re getting more value from your customer base. Note that if your ARPU stays below $100, you’ll need lots of customers to stay profitable.
4- Bookings
Bookings reflect the total value of signed customer contracts, no matter when you recognize the revenue. This future-focused metric reveals sales performance and revenue potential.
Unlike revenue in accrual accounting, bookings capture contract commitments right when they’re signed. B2B software providers, especially in enterprise software, rely heavily on this indicator. Teams use bookings data to determine commissions, track sales performance, and create forecasts.
5- Gross Margin
Gross margin reveals what percentage of revenue stays after paying direct software delivery costs. Calculate it by dividing gross profit (revenue minus COGS) by total revenue, then multiplying by 100.
SaaS businesses should aim for gross margins above 75%, while top performers reach 80% or higher. Strong margins point to good pricing power, efficient operations, and more resources for growth.
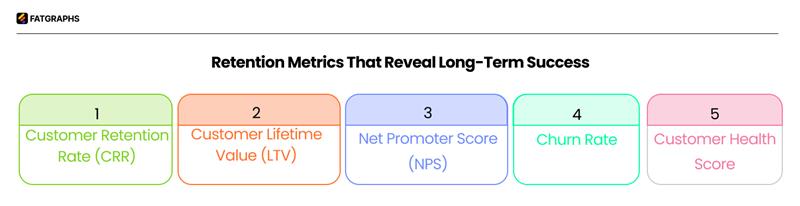
Retention Metrics That Reveal Long-Term Success
Customer retention in B2B SaaS metrics reveals much more than just sales and revenue numbers. These key indicators show if you’re building lasting customer relationships or just acquiring users who quickly disappear.
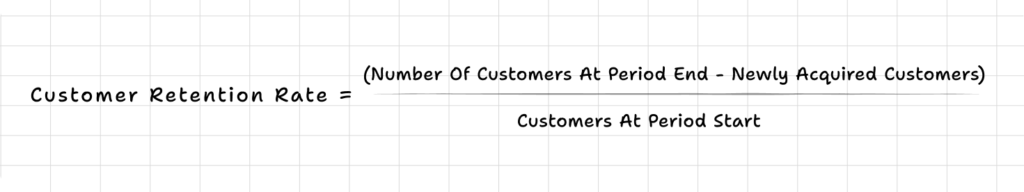
1- Customer Retention Rate (CRR)
CRR shows how successfully you maintain customer relationships over time. B2B SaaS companies in 2025 should aim for around 74%. Research from Mixpanel suggests that anything above 35% shows you’re on the right track.
2- Customer Lifetime Value (LTV)
LTV calculates the total revenue a customer generates throughout their relationship with your business. The simple formula reads:
CLV = Average Monthly Recurring Revenue per User (ARPU) / Customer Churn Rate
This straightforward calculation often produces optimistic results. Many businesses add discount factors to account for risk and the time value of money. SaaS businesses should aim for a CLV to CAC ratio above 3:1.
3- Net Promoter Score (NPS)
NPS helps you understand customer satisfaction and their likelihood to recommend your product. SaaS companies average an NPS of +36. The score comes from subtracting the percentage of detractors from promoters:
NPS = [% of Promoters] – [% of Detractors]
Customer responses fall into three groups:
| Detractors (0-6) | Unhappy customers who might leave |
| Passives (7-8) | Satisfied customers without enthusiasm |
| Promoters (9-10) | Loyal customers who promote your business |
4- Churn Rate
The percentage of customers who abandon your product over time is measured by churn rate. B2B SaaS companies see an average annual churn rate of about 3.5% – 2.6% voluntary departures and 0.8% involuntary (failed payments). Companies that are 5+ years old typically keep rates between 2-4%, while newer startups might see churn as high as 24%. A 5% reduction in churn can boost profits anywhere from 25% to 125%. Here’s how to calculate your annual churn rate:
Annual churn rate = (Number of customers at start of year – Number at end of year) / Number at start of year
SOURCE: vitally.io
5- Customer Health Score
Customer health scores help predict renewal likelihood by combining multiple B2B SaaS metrics into one clear indicator. Companies track these scores using points, letter grades (A-D), or color codes (green, yellow, red).
These valuable B2B SaaS metrics combine quantitative data (product usage, support tickets) with qualitative feedback (relationship quality, team input). Regular monitoring of health scores lets teams step in before small issues grow into bigger problems, making it an essential tool to prevent customer churn.
B2B SaaS Metrics Benchmarks (2026)
In isolation, metrics don’t tell you much. What matters is how your numbers compare to industry benchmarks. Below are widely accepted ranges for B2B SaaS companies:
| Metric | Range / Value | Interpretation |
|---|---|---|
| LTV:CAC Ratio | 3:1 | Healthy baseline |
| 4–5:1 | Strong, capital-efficient growth | |
| < 2:1 | Unsustainable, poor unit economics | |
| Customer Acquisition Cost (CAC) | Early-stage | Higher due to testing and experimentation |
| Growth-stage | Stabilizes as channels mature | |
| CAC Payback Period | 8–12 months | Best-in-class efficiency |
| 12–18 months | Acceptable range | |
| 18+ months | Cash flow risk | |
| Churn Rate (Monthly) | 3–5% (SMB) | Typical for small business SaaS |
| 2–3% (Mid-market) | Moderate retention | |
| 1–2% (Enterprise) | Strong retention | |
| Net Revenue Retention (NRR) | 100% | No expansion revenue |
| 110–120% | Strong performance | |
| 120%+ | Elite SaaS growth |
These benchmarks vary by pricing model, target market, and growth stage, but they provide a solid baseline for evaluating performance.
Related: SaaS Marketing Trends 2026: Strategies That Actually Work
Conclusion
Acquisition metrics reveal how well we bring new customers into our sales funnel. Lead-to-Customer Rate and Customer Acquisition Cost show if marketing efforts generate worthwhile returns. Engagement metrics demonstrate how users interact with products after acquisition. The Product Qualified Lead approach turns product usage into actionable sales opportunities.
Start with a few core B2B SaaS metrics instead of tracking everything at once. Your B2B SaaS metrics dashboard can expand gradually as your understanding grows to capture more nuanced aspects of business performance. Note that these numbers tell a story about your customer’s experience, from first contact through long-term loyalty.
A B2B SaaS company will make better decisions, optimize resources, and build stronger customer relationships that stimulate sustainable growth by measuring and responding to these performance indicators thoughtfully.
FAQs
1. What is a good churn rate for B2B SaaS?
A good churn rate typically falls between 1–3% monthly, depending on your customer segment and pricing model. Enterprise SaaS tends to be at the lower end, while SMB-focused products usually experience higher churn.
2. What is a healthy LTV: CAC ratio?
A 3:1 LTV: CAC ratio is considered the standard benchmark for sustainable growth. Ratios between 4–5:1 indicate strong capital efficiency and a well-optimized acquisition model.
3. What is the CAC payback period?
CAC payback period measures how long it takes to recover the cost of acquiring a customer. Ideally, this should be under 12–18 months to maintain a healthy cash flow.
4. Which SaaS metric matters most?
There is no single most important metric, as SaaS performance depends on multiple interconnected factors. However, LTV: CAC and NRR are the most critical indicators of long-term scalability and efficiency.
5. What is a good NRR?
A Net Revenue Retention (NRR) above 100% means you are growing revenue from existing customers. An NRR of 120% or higher is considered best-in-class and signals strong expansion revenue.